For cybersecurity product companies
Turn product value into a business case your buyer can defend.
VTC is a custom value model, reusable calculator, and customer-ready report built by vCSO.ai with Hubbard Decision Research for enterprise security sales.
Built with Hubbard Decision Research. Publicly deployed by Pixee.
Best fit for enterprise security vendors whose technical win stalls at ROI, the CFO, or procurement.
The methodology
Nick + Doug Hubbard, on how VTC works.
16 minutes of the joint methodology behind the calculator — calibrated estimation, Monte Carlo modeling, and how to convert your product’s mechanism into a number a CISO will defend on a board slide.
What makes it different
Three things every VTC build delivers.
Defensible numbers, not projections.
Monte Carlo simulations modeled with HDR’s calibrated estimation methodology. Quantified uncertainty, ranges instead of point estimates, every input traceable to a source.
Built on operator judgment.
Nick spent 15 years as the buyer for cybersecurity products at Silicon Valley Bank. The model encodes how real CSOs and procurement actually evaluate ROI — not how vendors wish they did.
Customized to your product’s mechanism.
Vulnerability remediation, threat detection, identity, compliance, AppSec — different products create value through different paths. Each VTC is tailored to your product’s specific value chain, not templated.
See how it works
Try a simplified version.
Pick a product category to load illustrative defaults, or move the sliders directly. A custom VTC uses product-specific variables and evidence; this teaser only shows the shape of the output.
The actual product
Inside the calculator.
The deployed tool runs on Streamlit, exports board-ready PDF reports, and customizes inputs per customer. Three views, in sequence: what your buyer sees on intake, how the model decomposes their value, and the distribution your sales team walks into the room with.
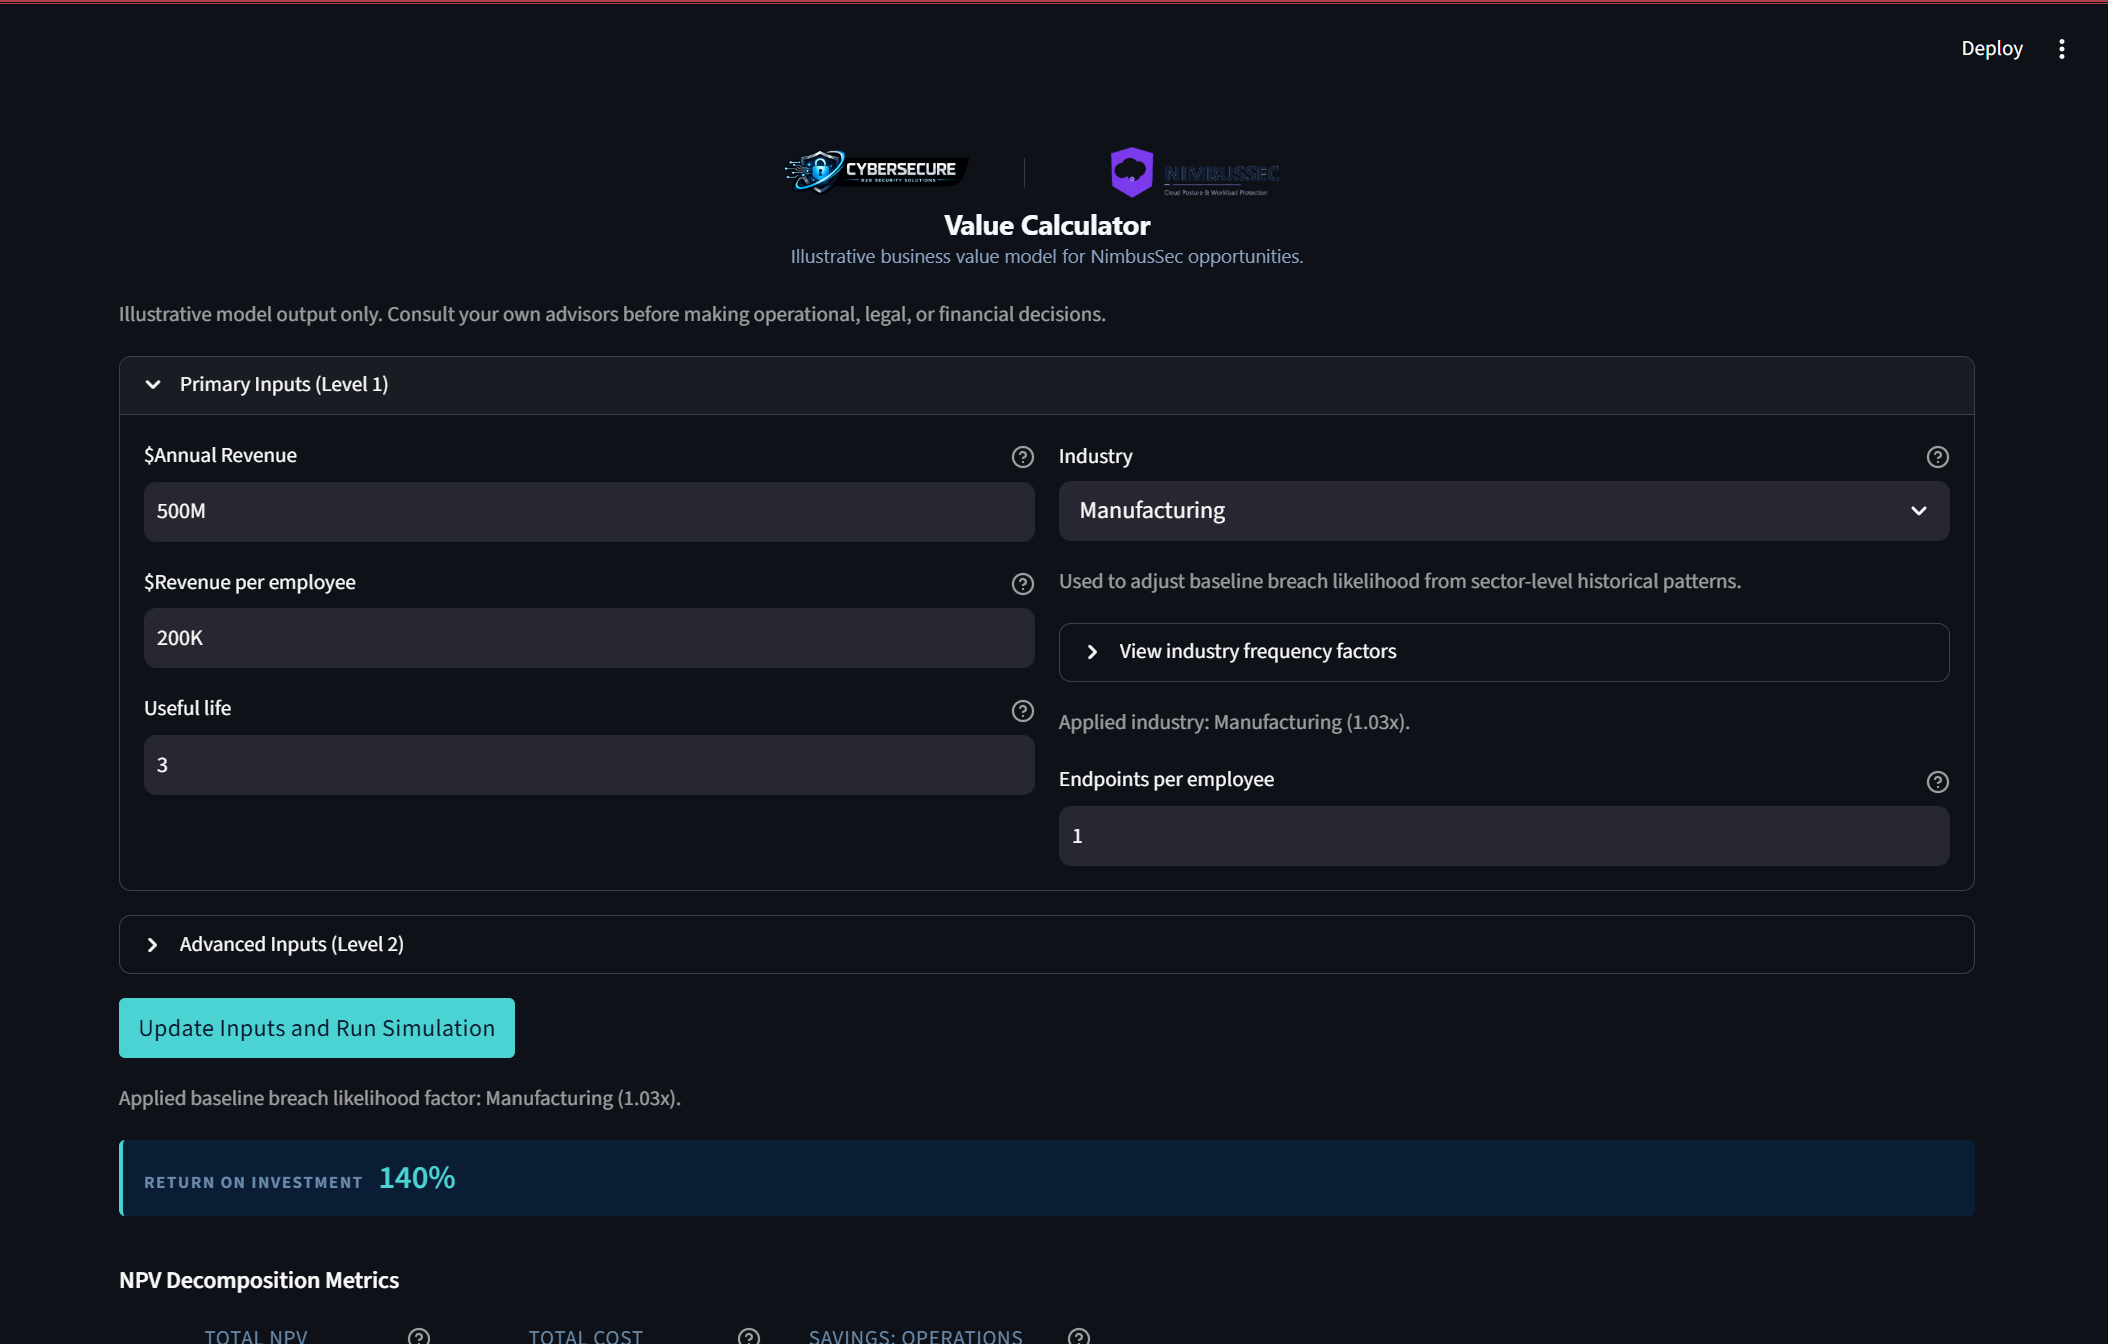
Inputs
Calibrated against your customer’s reality.
Primary inputs at the top: annual revenue, industry, useful life. Each industry pulls its own breach-frequency factor from IRIS data — manufacturing isn’t banking isn’t healthcare. Advanced inputs (Level 2) drop down for the variables only your product’s mechanism touches.
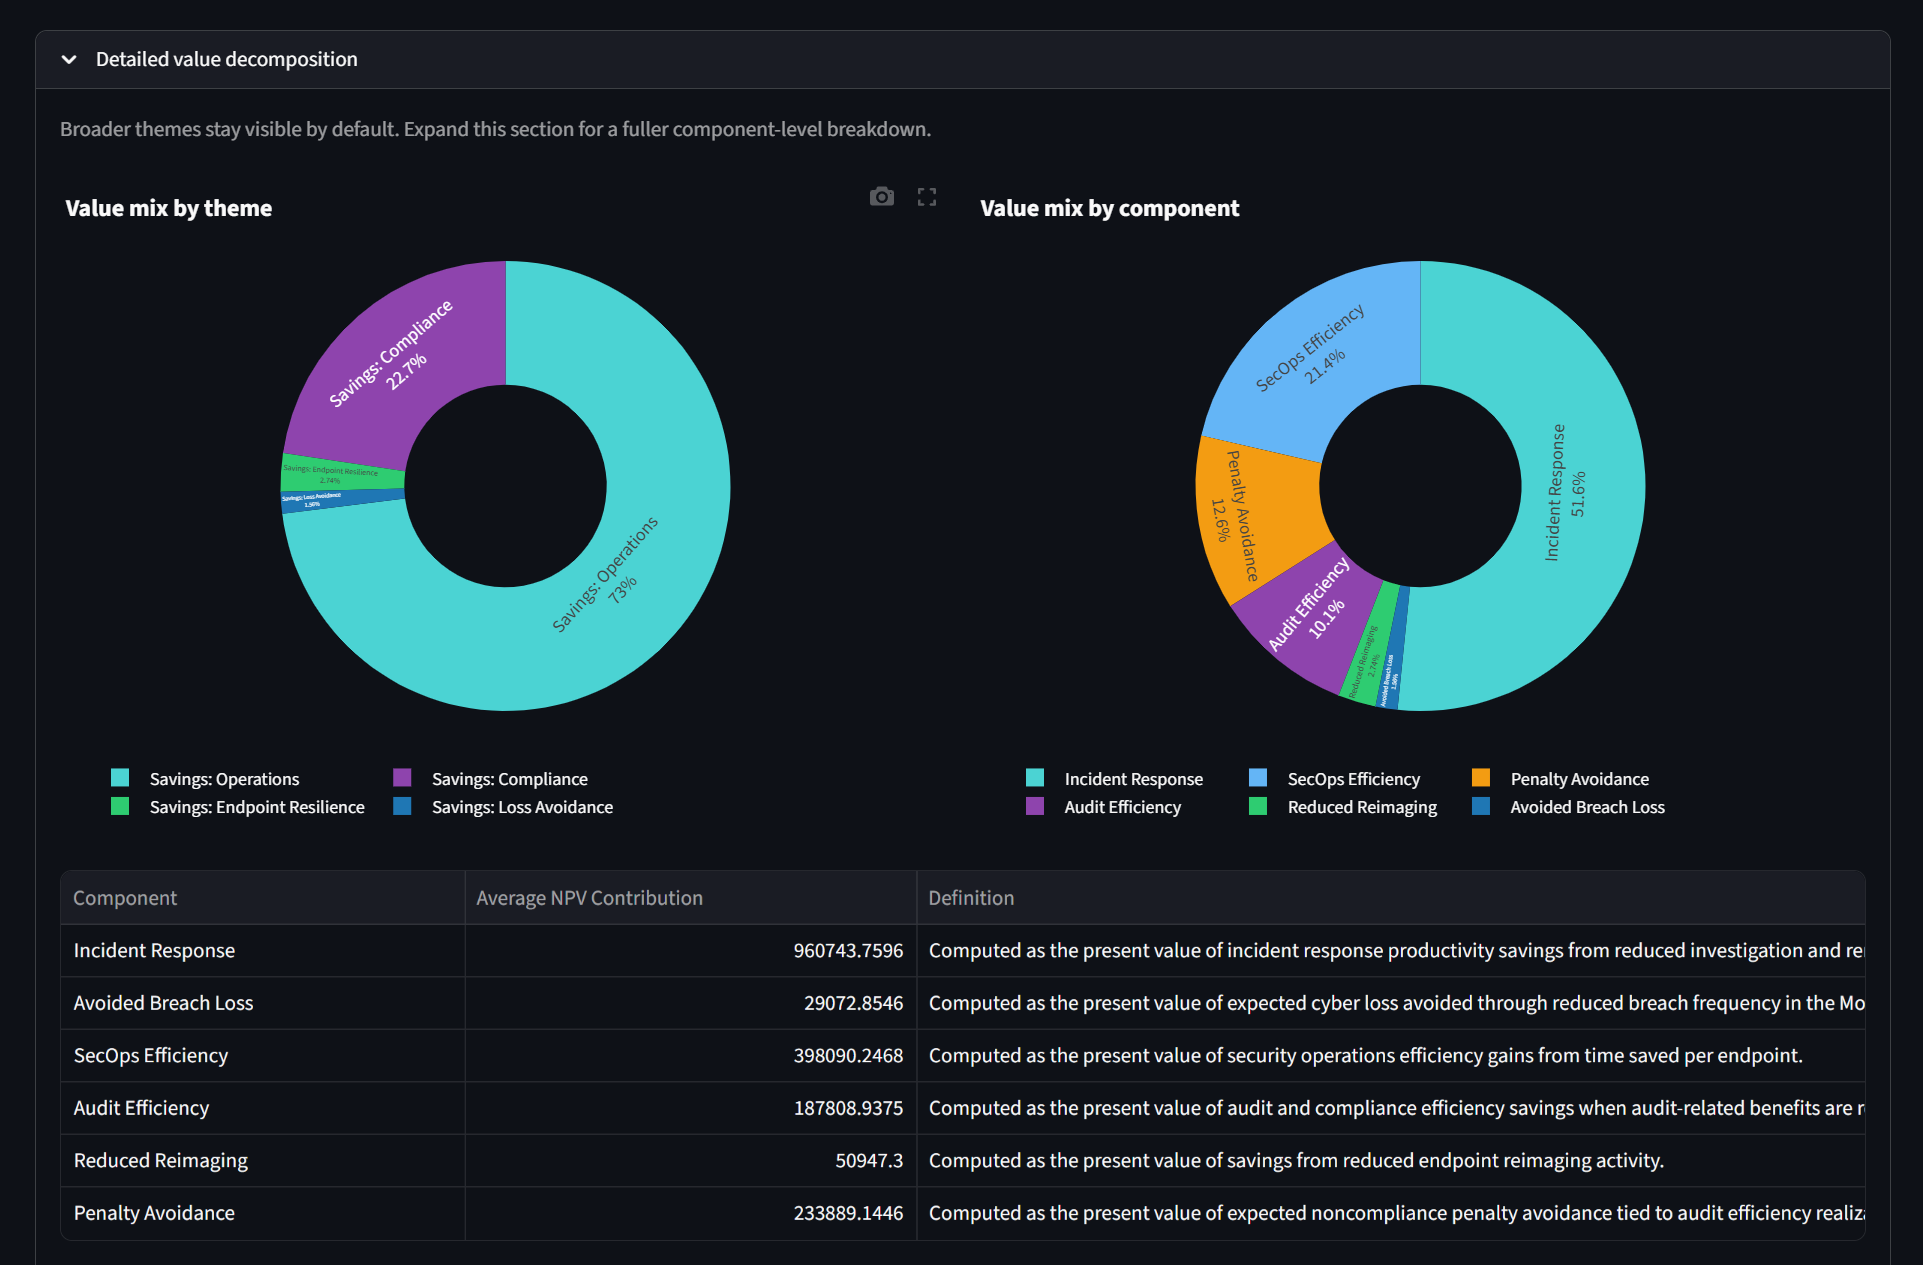
Decomposition
Value mix, traceable to source.
Two donuts and a per-component table. Every dollar of modeled NPV maps back to a specific value driver — incident response, avoided breach loss, audit efficiency, penalty avoidance. When your buyer asks “where does this number come from?”, the answer is on screen.
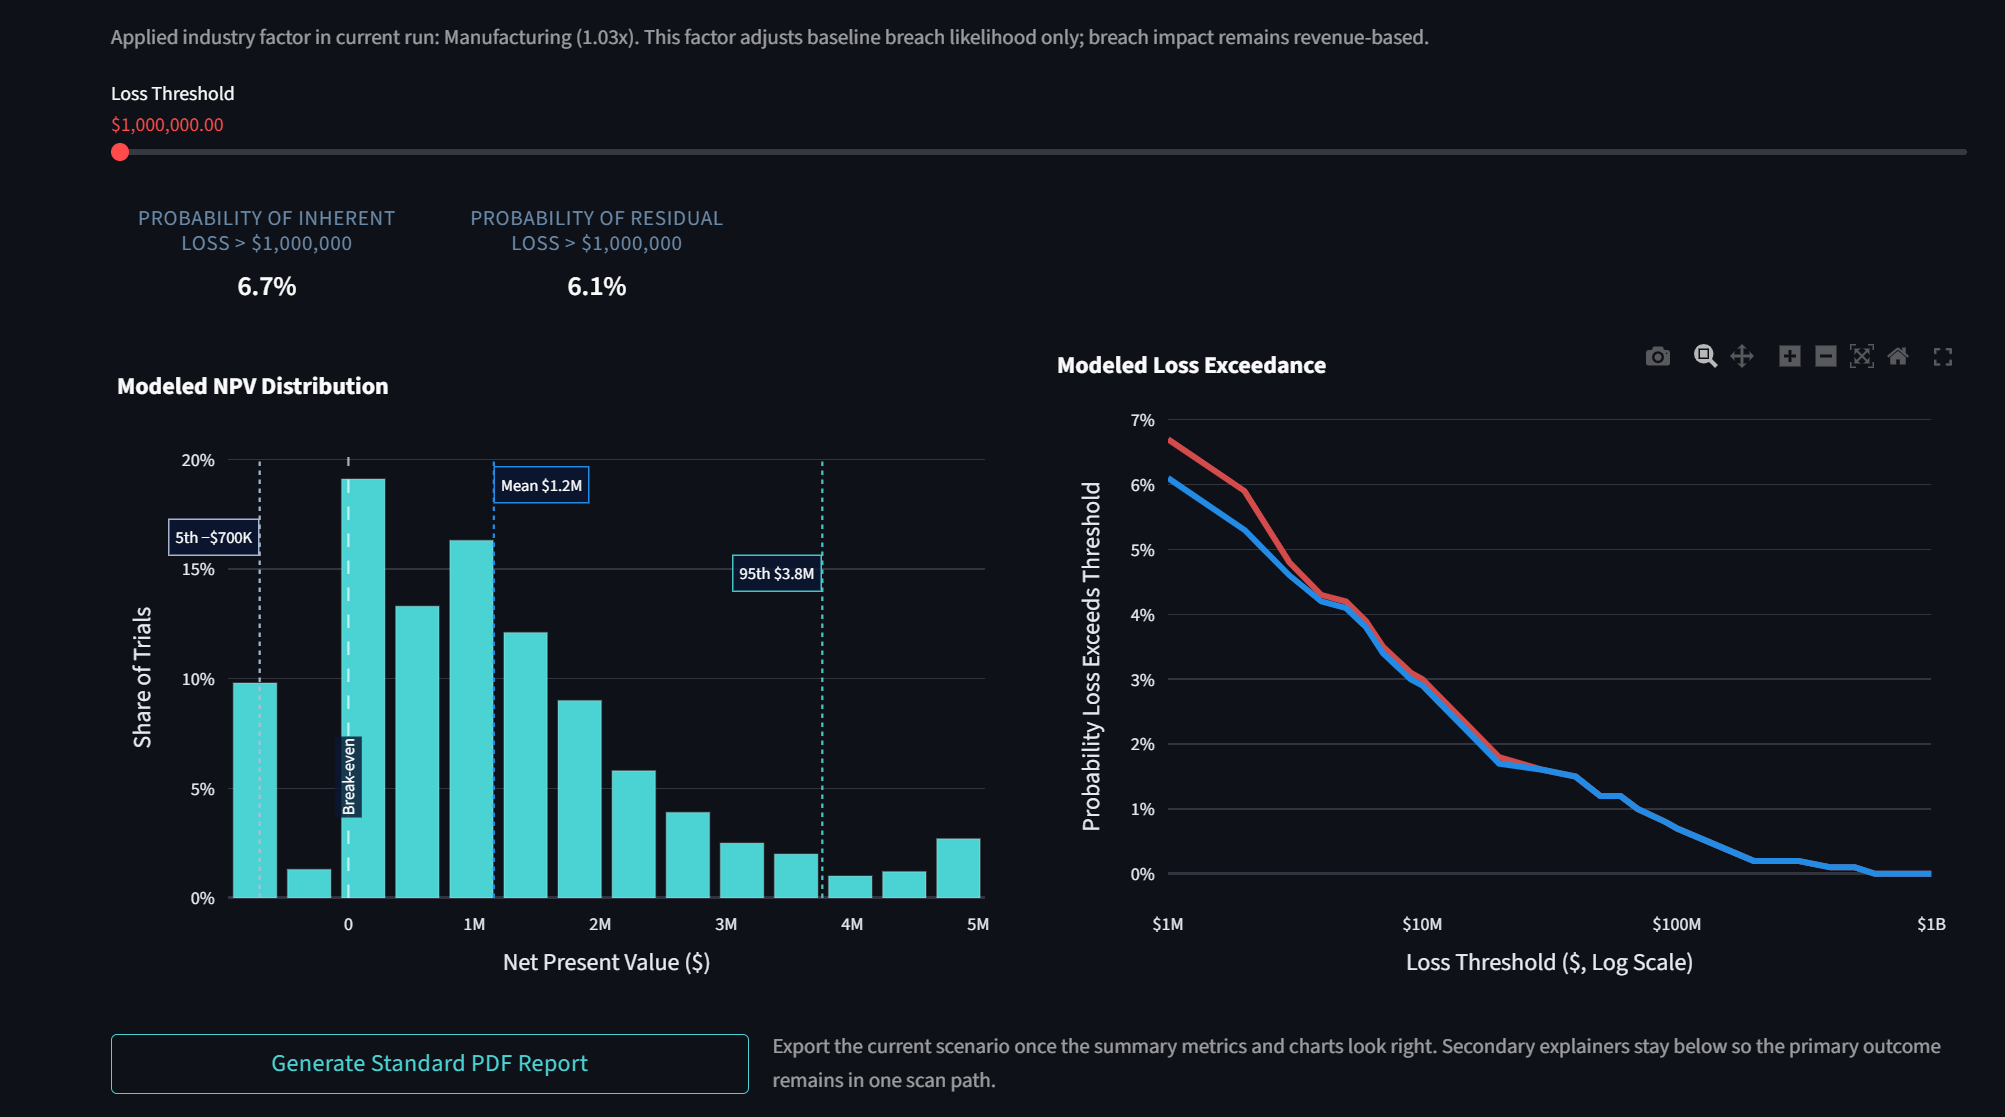
Distribution
NPV distribution + loss exceedance — the Monte Carlo proof.
The histogram shows the distribution of modeled NPV outcomes (5th to 95th percentile); the curve shows residual vs. inherent loss exceedance probability at every threshold. This is where the qualitative-risk-theater conversation ends and the defensible-numbers conversation begins.
The deliverable
A board-ready PDF, branded for your customer.
Every VTC build exports a multi-page report your sales team can hand to a CFO. Customer’s logo on the cover, your evidence in the body, the methodology cited at the back. Scroll the actual sample below.
Customer in production
Pixee runs VTC live on their pricing page.
Pixee publicly deploys a customized calculator on its pricing page. Prospects can enter their own context and see a modeled value calculation, demonstrating how a VTC can move from an internal model to a customer-facing sales experience.
See Pixee’s live deployment (opens in a new tab)
Public deployment
- Customized value inputs
- Self-service calculation
- Embedded in the buyer journey
How a build works
From value mechanism to a sales-ready model.
Every build follows the same arc — tailored to your product, calibrated against your real customer scenarios, delivered with your sales team trained to use it.
-
Discovery
We work with product and sales leaders to map the product’s value mechanism, the shape of a typical enterprise deal, and where the current business case breaks down.
-
Modeling
The team builds the value model around product-specific paths such as risk reduction, time savings, incident costs, or compliance impact. Key assumptions are expressed as ranges, not false-precision point estimates.
-
Calibration
We test the model against customer scenarios and available evidence, challenge the assumptions, and refine the ranges until the logic is explainable under buyer scrutiny.
-
Deployment + enablement
The engagement produces a reusable calculator, customer-ready report, and enablement for the people who will use it. Hosting, administration, support, and update rights are defined in the scope before kickoff.
Why it’s defensible
Built on Hubbard’s methodology, grounded in operator judgment.
HDR’s quantitative rigor
Doug Hubbard wrote How to Measure Anything in Cybersecurity Risk. His firm trains calibrated estimation through the AIE Academy and runs Monte Carlo models for governments, insurers, and Fortune 100 risk teams. Every VTC build inherits that methodology.
Nick’s buyer perspective
15 years as the buyer at Silicon Valley Bank means the model captures how procurement actually evaluates security spend — not how vendors wish they did. Risk theater gets cut. Defensible numbers go in.
The standard is not the biggest ROI number. It is a number the buyer can challenge and the model can explain.
What a VTC engagement produces
Value paths and evidence structured around your product and buyer.
A repeatable way to model customer context and uncertainty.
A branded business case a champion can take into the buying process.
Common questions
Before you book a call.
Why not just build this in Excel ourselves?
Spreadsheets handle math, not credibility. HDR’s methodology adds calibrated estimation training, Monte Carlo distributions, and sourced evidence — the things a CFO actually cross-examines. A homegrown spreadsheet gets challenged on every input. A VTC build comes with the methodology citations baked in.
What’s customized vs. templated?
The model architecture is templated (Monte Carlo, calibrated estimation, NPV/ROI outputs). The variables, value paths, and inputs are 100% customized to your product. A vulnerability remediation product and a compliance product have completely different value chains — we don’t pretend otherwise.
Who owns the model after delivery?
Ownership and operating rights are defined in the engagement scope. Your confidential data and supporting evidence remain protected; HDR’s underlying methodology remains HDR’s. Hosting, source access, administration, and update rights depend on the deployment your team chooses.
Can we update it as our product evolves?
Yes. The model is designed so assumptions and evidence can be revisited as the product, pricing, and market change. The update process and any ongoing support cadence are defined as part of the engagement scope.
How does it integrate with our sales process?
A VTC can support a guided sales conversation, an internal enablement workflow, or a customer-facing experience. Reps can capture customer context, run the model, and produce a branded report; the exact workflow is configured around your sales motion.
What does it cost?
VTC is a custom engagement. Scope depends on the number of product lines, the evidence available, deployment requirements, integrations, hosting, and enablement needs. A fit review is the first step; after that, we can define the work and price it responsibly.
See whether VTC fits your sales motion.
Bring your product, a typical enterprise deal, and where the deal tends to stall. We’ll map the likely value mechanism and identify the evidence a defensible model would need.